How Does Search Console's Core Web Vitals Report Update Over Time?
When it comes to The Chrome User Experience Report (CrUX) data, there's a few different time spans out there in the guides and documentation. PageSpeed Insights uses it for the field data they display, and they, according to their support docs, use a rolling 28-day window, so the scores are aggregated for that device type for the past 4 weeks. The same is true for The Chrome UX Report API
The Public Dataset made available on BigQuery, and also used in the CrUX Dashboard on Data Studio is updated once a month.
What about Google Search Console?
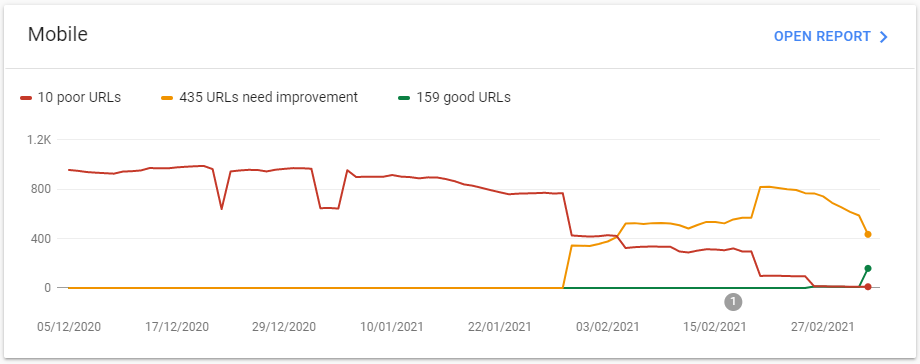
There's no explicit information in the supporting documentation on what timespan is involved in Search Console's aggregation, we have two date spans. The first timespan is the charts, these give 90 days of data.

But looking at the chart, there is a good bit of change going on, it doesn't look as smooth as one would expect if these figures were being aggregated across the full 90 days.
The other date that is mentioned, in the supporting documentation for this report is that familiar 28 day one.
It's mentioned concerning validating fixes. Specifically, they state that starting a validation will kick off 28 days of them monitoring the metrics and seeing if they pass at the end.
So, How Do We Find Out?
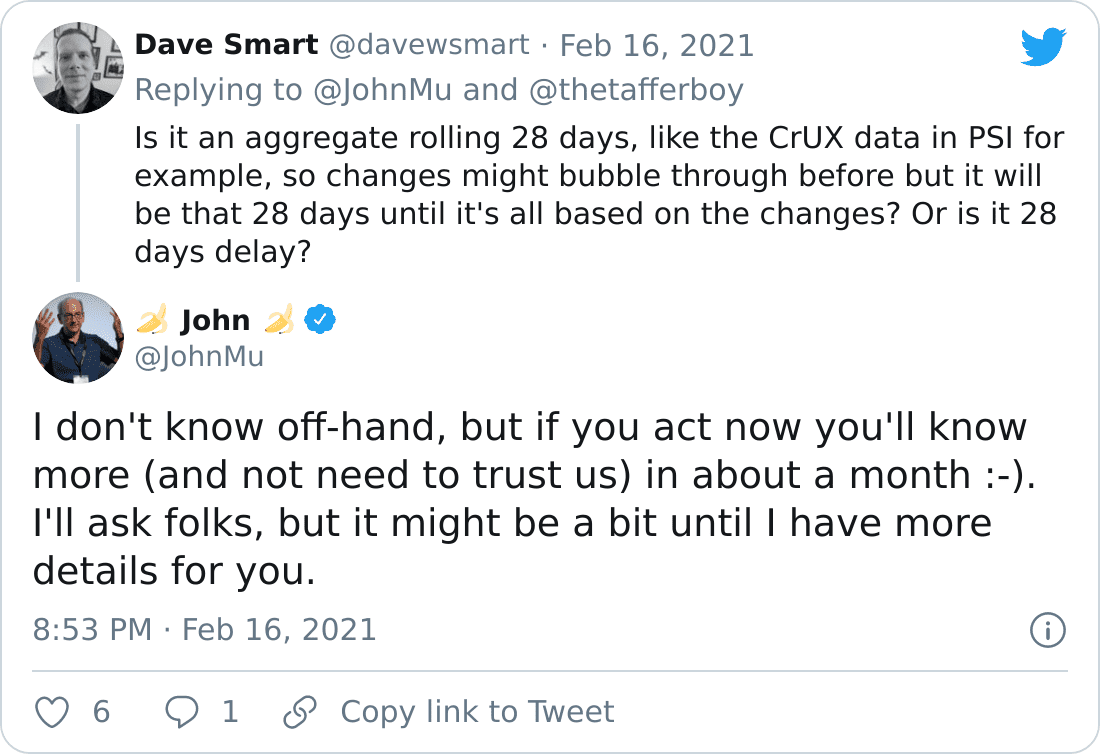
Well, we can be lazy and ask Googlers, like the eternally patient John Muller:

But, like he rightly points out, testing yourself is the greatest way to learn. So that's what I did.
The Test (Cut a Little Short)
Identifying a suitable candidate and running a test for this presents a fair bit of a challenge. The nature of CrUX, and how it's collected, means that sustained volumes of traffic, using chrome with the Required sharing and sync options enabled, over time are needed.
This pretty much excludes any controlled, purpose-built test site, what we need is a site that:
- Has Enough CrUX data to populate the Search Console report for the property.
- Has identifiable issues, that can be fixed.
- Has an understanding owner that would let me run the test.
I managed to find one that ticked all the boxes!
The Site
The site I found is an e-commerce site, carrying some CLS issues, that haven't been addressed as it's about to migrate to both a new domain and re-platform. All developer resources have, naturally, been poured into that, and not this.
As understanding and amazing as the client is, they don't want the site identity revealed, so sadly no real URL examples.
The switch over was planned for the end of March 2021, I commenced the test on the 17th Feb 2021, so that should have given me the full 28 days and a bit more. But, in a first-ever for web development, The Change Was Moved Forward!!!. Sucks for this test, but super happy for the client and the new site, it's ready to go, so not even a question of needing to hold on.
That does mean, however, that there are only 19 days of data, not the full 28 I was planning for. I considered ditching the idea of writing this up, but I think the data still tells a story.
Testing Methodology
I needed to isolate the issues as much as possible, fix them, and monitor the results. I did this by looking in the Core Web Vitals report in the sites search console.
I collected the figures each day, starting on the 17th of February, up until today, the 7th of March. The data in the search console is dated 1 day behind as shown on the 'Last Updated' field in the top right of the report view. So data I collected on the 17th was from the 16th, and so on. This normally updated by 10:30 am (GMT). Sometimes it was a little later. I waited until it had updated.
For the origin Data, I checked at 2 pm each day
For the self-collected real-world data, I segmented it out to mobile visitors and calculated the 75th percentile for each day.
I also wanted to test if clicking the validation button does anything noticeable other than monitor the data, like accelerate data collection, so I waited what would have been halfway through the 28-day test, the 2nd of March, and requested validation.
The Groups
Search Console groups URLs together, the documentation explains that this is done by URLs that "provide a similar user experience". That seemed to fit what I found, the URLs were grouped into fairly distinct types, that did seem to have common issues amongst them. As the site is a fairly standard e-commerce site in structure, these did fall roughly into page types, i.e. product listing pages, product detail pages. So it could be that there's some element of page structure that's used to group pages, but the division into these groups is explainable by just common page issues alone. Plus a couple of the groups were all product listing types, split into different groups, as one had just one major driver of CLS, the other had that plus another one.
To narrow down the focus, I looked at just the mobile figures, and just CLS, a metric that's a little easier to make sure it's fixed, and I could fix for the client without sucking up dev time. LCP can be a little more dependant on infrastructure, and would have required changes the dev team needed to make, something they had no time for. The site had zero FID issues to track and fix. So CLS is was.
Group 1
This was the biggest group. Starting on the 17th of February, there were 216 URLs counted with a CLS of 0.3. The shift was caused by a side filter / navigation column, that on mobile viewports stacks on top of the main column instead, and is collapsed, with a button to click to show and hide this.
The required CSS classes to change this were added by JavaScript, which ran on document ready, meaning that there were flashes and shift as this happened after page load.
I changed the logic so that additional classes weren't needed to collapse the column on mobile, so no need to add anything by JavaScript.
Local testing on some examples from the group showed that a CLS of 0.28 - 0.31 dropped to 0.03 - 0.04 (tested was done using a simulated Moto G4 and Fast 3g speeds)
Group 2
This group of 79 URLs had a CLS of 0.5 on the 17th. The shifts here were a combination of the same issue as group one, with another additional top navigational element showing the same behaviour.
Fixing both took local testing figures from 0.48-0.53 to the same 0.03 - 0.04 as group 1.
Group 3
This group of 11 URLs had a CLS of 0.76 on the 17th. Unlike group 1 & 2 these were product detail pages. A combination of missing image dimensions and a misbehaving carousel were the major issues.
Local testing showed a CLS of 0.6-0.82, reduced to 0.01
Group 4
This group of 53 URLs had a CLS of 0.14 but only made a brief appearance in Search Console, popping up on the 1st March, and disappearing after the 5th. Like group 3, they were product level pages, Local testing showed a CLS of 0.01 by the time they appeared, but did have more items in the carousel. So I can only hypothesise that they were worse than group 3 and would have been reported as so, but there was not enough CrUX data on this set to report throughout the test.
Good Group
This group popped up on the 27th of February with 13 URLs and a CLS of 0.03. These mostly seemed to be comprised of URLs that would have fallen in the first three groups. Local testing seemed to agree with this 0.03 CLS figure.
I suspect they only got enough data to start showing in the report after they were fixed and therefore never landed in the other groups.
Other Data
I also checked the CrUX API daily to get the origin data to track how the CLS was falling site-wide, and also collected real user data using the web-vitals JavaScript library, recording device type along with the metric.
The Data
The Full Data
CLS over time
All groups, plus Origin & Real User Measurements (RUM)
Group 1 CLS & Count
Group 1's CLS and Number of URLs from Search Console.
Group 2 CLS & Count
Group 2's CLS and Number of URLs from Search Console.
Group 3 CLS & Count
Group 3's CLS and Number of URLs from Search Console.
Group 4 CLS & Count
Group 4's CLS and Number of URLs from Search Console.
Good Group CLS & Count
Good Group's CLS and Number of URLs from Search Console.
Conclusions
Time Spans
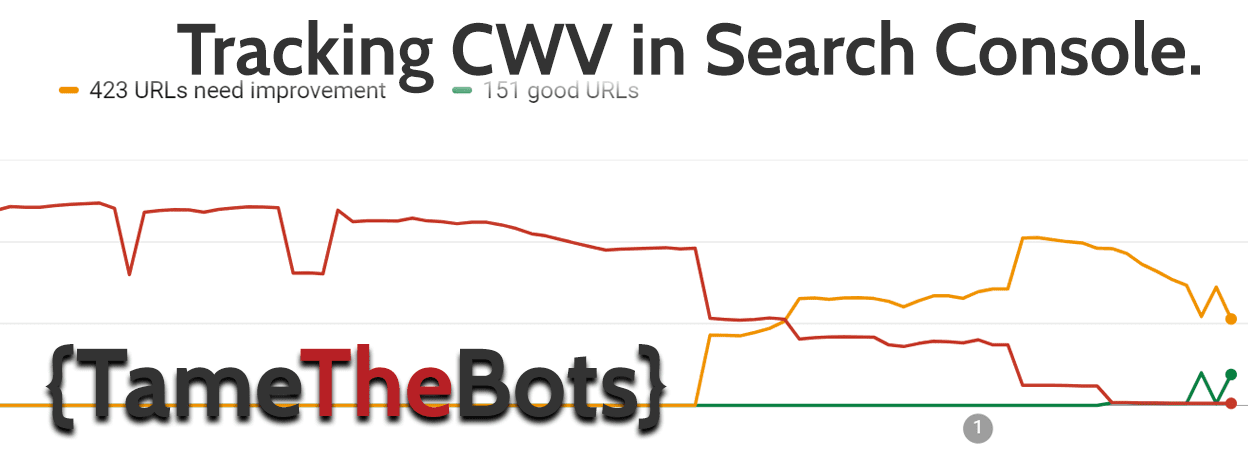
It appears that Search Console works like the CrUX API, and has a rolling, 28-day window. Looking at the charts, the lines trend down over the 19 days of data I was able to gather. They are also clearly aggregated over a timespan, the drop was gentler than the sharp per day drop.
I cannot say with absolute confidence that the window is 28 days, it could be shorter or longer, but it seems to fit and being a common timespan with the CrUX API, and PageSpeed Insights, I would be very surprised if it was different.
Validation
The shortening of time this ran gives less confidence here, but it appears it's purely a monitoring process, and requesting validation doesn't change what is collected and reported on.
Other Observations.
There appears to be around 2 days lag from fixing until that begins to get reflected in the Search Console. One day is explained by the report updating a day behind, and it seems it trails a further day. Looking at the data, it took until the 3rd day until any movement was observed.
It can jump a little. I suspect there are periods that not enough data has been collected on the group by CrUX, so it holds station until the next time there is enough. That would explain the flats and dip nature of the chart. I suspect this site is somewhat at the lower limit of the amount of valid mobile visits to collect data. (see also this update)
Other Thoughts
Instinctively, I felt that the grouping in search console was a bad idea. I, like many others, always think more data is, well, more. I especially thought that the limit of 20 example URLs from any group was far too limiting.
However, in practice, this was actually more than sufficient to identify the problem areas this site had, and fix them. All without an overwhelming amount of data. I'd probably still advocate for more coverage here, and it might well be more of an issue with a site that has more variation across pages. But perhaps that would be handled by more groups being shown.
I really wish I had been able to run this test to its conclusion, I hope someone else out there gets to do that! But I don't think the conclusions would have been any different, and I hope this somewhat shortened test is of some use.
Update - 19th April 2021
Barry Pollard has published an excellent article on Smashing Magazine about measuring core web vitals, and rightly points out I'd neglected to factor in the effects of aggregating on the 75th percentile, which I fully agree would also go a good way to explain the curves I saw in the test. It's an excellent piece, go read it!
