
When tracking Core Web Vitals gathered from real users, the recommended pass or fail point is at the 75th percentile. Basically you pick the score that at 75 percent of users got that or better.
Because real user metrics are inherently noisy (there's a lot of variables you don't control), it's also not a good idea to rely on very short time frames.
The Chrome User Experience Report (CrUX) reports on a 4 weeks basis, 28 days being a sensible period to smooth out changes. CrUX powers a lot of the Core Web Vital stuff you'll see out there including search console.
However, that mean that tracking changes you've made can be tricky, if you're just looking at the 75th percentile, something I've covered before in Tracking Changes in Search Console's Core Web Vitals Report and something Barry Pollard covers well in An In-Depth Guide To Measuring Core Web Vitals.
Measuring the 75th percentile this way means that changes can take some time to come through, meaning it can take some time to verify if fixes you've made are working as intended.
Enter the Histogram
CrUX now offer a history api to let us track changes over time.
Along with the 75th percentile values, they also provide histogram data alongside that, or to put it another way, the distribution of users. This is the percentage of users that fall into each bucket of the histogram, good, needs improvement & poor.
They provide this in weekly chunks, for the last 25 weeks, each chunk being a the 4 week period moved on by a week.
So we can see how the 75th percentile has changed over time, but we can also see how the histogram has changed over time, and changes show much faster this way.
A Free Tool
Viewing this data is why I built the Visualize Core Web Vitals History tool I added to the site the other day. I often broke clients data down this way, and realised it would be simple to share that with everyone.
It's a simple tool, you just enter the domain you want to check, and it'll pull the data from CrUX and display it, and you can choose to chart that either by 75th percentile, or the distribution (the histogram data).
A Real World Example
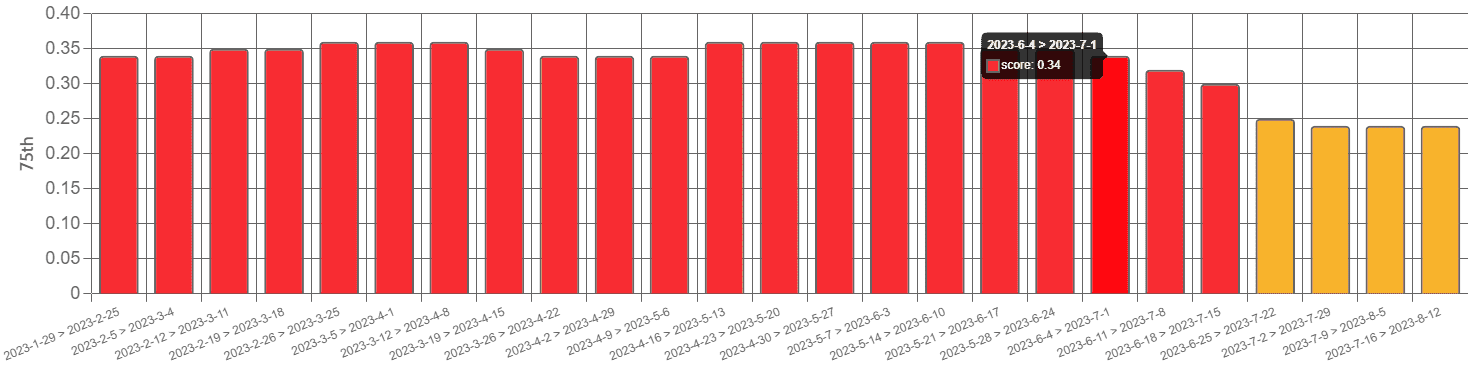
Here's a real world example, a site had a issue with CLS for the home page that was caused by lack of dimensions on a image, and an block of content that loaded in an iframe that pushed stuff down. This isn't about the fixes really, but it was just a couple of lines of CSS.
They added the fixes I suggested around the 29th of June. From the data, here's the 75th percentile chart of CLS:
And here's the histogram:
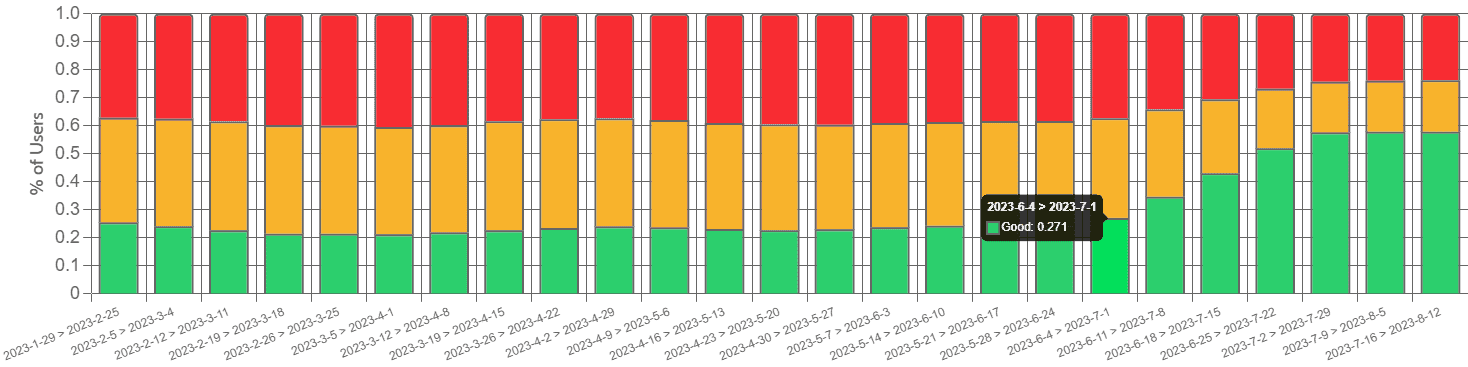
The first week that covers the changes is 2023-6-4 > 2023-7-1, and whilst the improvement shows in both, in terms of telling a story of where things are going, the histogram one to me is much clearer about things improving.
But it tells us more too than the single 75th percentile figure. Both show that there's still room for improvement, but the histogram shows that the changes improved the experience for folks that were falling into the needs improvement bucket more than those who were getting poor results.
That helps you focus efforts on where to look next. (In this case it's down to the fact the site becomes an Single Page Application and the CLS happens when transitioning between pages, being an SPA, these are attributed to the first page they land on).
Summing it Up
This isn't an article about the 75th percentile being a bad metric, it's not at all, it's really useful. It's really about the fact that sometimes it helps to look past just that.
Taking the above example to the extreme, you could theoretically have an issue on the site that meant nearly 25% of the visitors were having a bad experience, but the other 75% were good. That's still nearly 1 in 4 of your users having a bad time on your site, even though the 75th percentile was telling you you pass.