What are Bookmarklets?
Chrome allows you to create a bookmarks that run a some JavaScript on the page you are looking at, that gives us the ability to run some quick tests and checks on a page, perfect for some quick spot checks when you are breezing through a site. I find they don't take the place of a full testing tool like Deepcrawl or Screaming Frog which can provide a much greater in-depth delve across a site, but sometimes a quick look is all you need.
How Do You Make One?
They're pretty simple to make out of your favourite scripts, they are structured like this:
javascript:(function() {

/* JavaScript here...... */

})();
There's a couple of gotchas, when you paste this into chrome's bookmark manager, it will be converted to 1 line, so comments need to be in the /* comment */ format, not // comment. Semi colons matter too, so make sure you end a line with ;
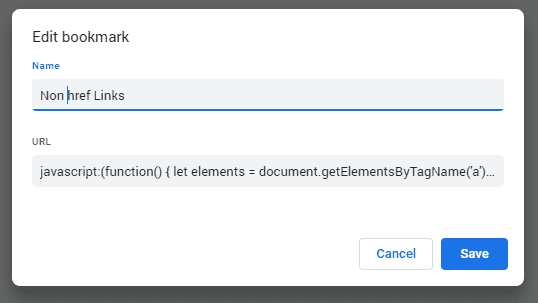
To add a bookmarklet into chrome, open the bookmark manager (Ctrl + Shift + O for Windows & Linux, ⌘ + Option + b for Mac), click the three dots in the top right, give it a name and copy your bookmarklet into the URL line.

I tend to go for the approach of outputting to the console, although you could inject the output straight into the DOM. To run it, go to the page you want to test, then just select the bookmark, like you normally would to visit a different page.
Some Example Bookmarklets
Here's a few example ones to get you started on how these can work:
Get all <a> tags without a valid href
This lists out all <a> tags that either don't have an href, or just trigger a JavaScript function, useful for spotting links Googlebot won't crawl:
javascript:(function() {
let elements = document.getElementsByTagName('a');
for (let node of elements) {
  if (!node.href || node.href === '' || node.href.startsWith('javascript:')) {
    console.log(node);
  }
}
})();
Drag this link to your bookmark bar to install this bookmarklet: show non-href links
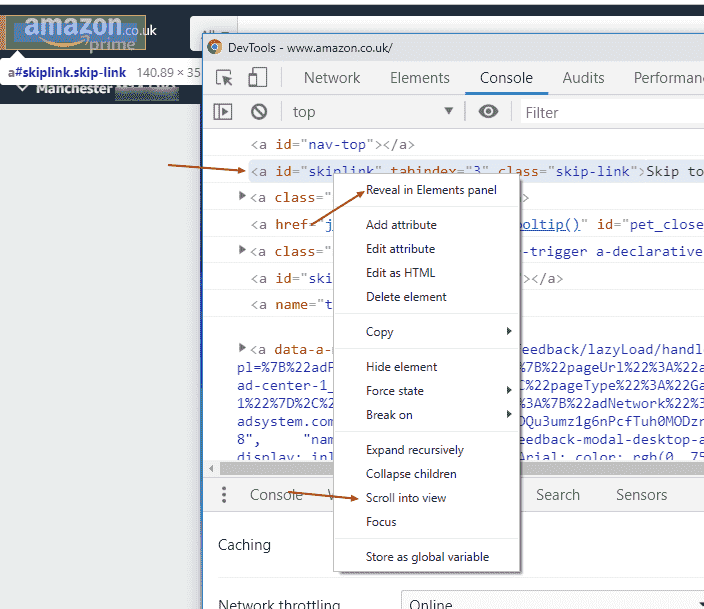
I like to output any element / nodes based stuff to the console, you can then interact with the list in console, hovering over it will highlight it, right clicking will let you scroll it into view (if a visible element) or inspect it in the elements panel.

Open Search Console Performance Report, filtered on current URL
This opens the Search Console performance report in Search Console, filtered by the URL you're viewing. Handy for a quick look at how a page is doing
Some Gotchas:
- It only works with url-prefix properties, not Domain properties
- If you're looking at https://example.com/foo-bar, you'd need https://example.com/ added and verified as a property.
javascript:(function(){
    window.open(`https://search.google.com/search-console/performance/search-analytics?resource_id=${encodeURIComponent(window.location.origin)}&page=!${encodeURIComponent(window.location.href)}`)
})();
Drag this link to your bookmark bar to install this bookmarklet: GSC Perf for URL
Get all <h1> to <h6> Tags
javascript:(function() {
for (i=1; i<=6; i++) {
  let elements = document.getElementsByTagName('h' + i);
  console.log('##### Start of H' + i + ' Tags #####');
  for (let node of elements) {
    console.log(node);
  }
  console.log('##### End of H' + i + ' Tags #####');
}
})();
Drag this link to your bookmark bar to install this bookmarklet: Get all H1 to H6 Tags
Validate an AMP page
This can be done pretty simply by visiting validator.ampproject.org, but if you want a quick check without leaving the site:
javascript:(function() {
/* Check if amp page by looking in the Window Object for AMP */
if(typeof window.AMP !== 'undefined') {
/*check if validation is available already by testing the Window Object for amp, if missing inject the validator script */
if (!window.hasOwnProperty("amp")) {
var ampValScript = document.createElement('script');
ampValScript.src = "https://cdn.ampproject.org/v0/validator.js";
document.getElementsByTagName('head')[0].appendChild(ampValScript);
}
var pageStatusCode;
(async() => {
/* wait for amp to become available (takes care of the delay caused by waiting for the injected script) */
while(!window.hasOwnProperty("amp"))
await new Promise(resolve => setTimeout(resolve, 1000));
/* refetch initial html for test */
fetch(location.href, {mode: 'cors'})
.then(function(response) {
pageStatusCode = response.status;
return response.text();
})
.then(function(text) {
/* validate and output results */
var results = amp.validator.validateString(text);
if (results.status === "PASS") {
/* log to console with some simple styling */
console.log('%c Verdict ' + results.status + ' ' + pageStatusCode, 'font-weight: bold; color: green');
} else {
console.log('%c Verdict ' + results.status + ' ' + pageStatusCode, 'font-weight: bold; color: red');
}
if (results.errors.length >= 1) {
var output = amp.validator.renderValidationResult(results, /*filename=*/ 'web_input').join('\n');
console.log("Errors",output.split("\n").slice(1).join("\n"));
}
})
.catch(function(error) {
console.warn('Request failed', error);
});
})();
} else {
console.warn('%c Not AMP Page', 'font-weight: bold; color: red');
}
})();
Drag this link to your bookmark bar to install this bookmarklet: Validate AMP
Check If Mobile Friendly
This script uses the api from google to test the page and return a verdict and list of errors (if applicable!). To use it you'll need an api key, you can get it from here: Google Developers Get Started Guide. There's much more detail if you use the Mobile-Friendly testing tool https://search.google.com/test/mobile-friendly, but like the AMP test, can be useful for a quick spot check on a page without having to navigate off.
javascript:(function() {
function fetchMFT(url) {
return new Promise(resolve => {
/* get your API key here: https://developers.google.com/speed/docs/insights/v5/get-started  */
var MftApiKey = 'Your API Key';
var apiurl = 'https://searchconsole.googleapis.com/v1/urlTestingTools/mobileFriendlyTest:run?key=' + MftApiKey;
var data = {
url: location.href
};
var options = {
method: 'POST',
mode: 'cors',
headers: {
'Content-Type': 'application/json'
},
body: JSON.stringify(data)
};
fetch(apiurl, options)
.then(res => res.json())
.then(response => {
resolve(response)
})
.catch(error => {
resolve(error)
});
});
}
async function doMFT(url) {
console.log(url + ' Sent For Testing.');
const output = await fetchMFT(url);
/* Add Status */
if (output.testStatus.status === 'COMPLETE') {
console.log('%c Status: ' + output.testStatus.status, 'font-weight: bold; color: blue');
} else {
console.log('%c Status: ' + output.testStatus.status, 'font-weight: bold; color: red');
}
/* Add Verdict */
if (output.mobileFriendliness === 'MOBILE_FRIENDLY') {
console.log('%c Verdict: ' + output.mobileFriendliness, 'font-weight: bold; color: green');
} else {
console.log('%c Verdict: ' + output.mobileFriendliness, 'font-weight: bold; color: red');
}
/* Add Errors */
if (output.mobileFriendlyIssues && typeof output.mobileFriendlyIssues !== 'undefined') {
var mess = "";
output.mobileFriendlyIssues.forEach(issue => {
mess = mess + issue.rule + '\n';
});
console.log('Errors: ' + mess);
}
}
doMFT(location.href);
})();
Run a PageSpeed Insights Test
Like the Mobile Friendly Test, you need to get an api key, you can use the same one as the mobile friendly check. This script outputs a few values, then dumps the array containing the results as an object, just click on the triangle to expand the object and view the data.
javascript:(function() {
function fetchPSI(url) {
return new Promise(resolve => {
/* get your API key here: https://developers.google.com/speed/docs/insights/v5/get-started  */
var MftApiKey = 'Your API Key';
var apiurl = 'https://www.googleapis.com/pagespeedonline/v5/runPagespeed?url=' + url+ '&key=' + MftApiKey + '&strategy=mobile';
var options = {
  method: 'GET',
  mode: 'cors',
  headers: {
    'Content-Type': 'application/json'
  }
};
fetch(apiurl, options)
.then(res => res.json())
.then(response => {
  resolve(response)
})
.catch(error => {
  resolve(error)
});
});
}
async function doPSI(url) {
  console.log(url + ' Sent For Testing.');
const output = await fetchPSI(url);
console.log('FCP: ' + output.lighthouseResult.audits['first-contentful-paint'].displayValue + ' FMP: ' + output.lighthouseResult.audits['first-meaningful-paint'].displayValue + ' TTI: ' + output.lighthouseResult.audits['interactive'].displayValue + ' TBT: ' + output.lighthouseResult.audits['total-blocking-time'].displayValue);
console.log('Full Test: ', output);
}
doPSI(location.href);
})();
Everyone's process is different, and we all like to look at different things in our own way, so I'd imagine that these specific tests will only appeal to a few, but the power of interacting with the page via JavaScript is there's so many different tests you could do, so it's possible to shape and craft a toolbox that fits your needs.
Half the joy (for me at least!) is building and creating these things for ourselves, but I'm also really nosy so I'd love to hear if you have useful bookmarklets you like to use.
