
Web Performance in the Real World.
A long time ago in an internet far, far away… people started to care more about the performance of websites for their users, how quickly were these sites they were slinging across the wires got to the eyeballs of the eager visitors.
Site owners looked closely at things like time to first byte, the delay between asking for a website, and getting the first bits of it back. They looked at overall download sizes, were things cached, and measures like that, all this was (and still is) good.
Off the Racetrack, into the Streets.
Then people thought about it more, and realised that it's not only the speed we squirt things across the internet to our users, but also how quickly these things get glued together that matter. Thus was born metrics like First Paint (how long until the first pixel of a site starts showing) First Contentful Paint (how long until the first actual bit of content starts showing) and First Meaningful Paint (how long it takes for the primary content to appear).
This represented a marked shift in only looking at how sites were sent out from a server, to a more holistic approach that took account of how the site would be perceived by the people consuming it. Something that became even more important when you factor in that not everyone's device is equal, and sometimes it's what happens in the browser that's the true bottle neck.
This is something that's been amplified even more by the growth of client side rendered pages, where so much happens in the browser that formerly would have been done before the page was ever sent.
This was an important step to me, it was a step away from the Dragstrip mentality of speed is all, to a more nuanced view of how real people experience websites.
Catching the Eye of the 800-pound Gorilla.
Website owners weren't the only ones to cotton on, Google noticed too, and performance metrics started to play a small factor in their rankings. With this, they were beginning to align themselves with website users, who have been being annoyed by poor performing websites since nearly as long as there's been websites.
So Many Metrics, So Little Time
More metrics followed on the way, Time to Interactive, First CPU Idle, and more, all useful, and still are, but audits and checks were turning into a word salad of acronyms, enough to glaze over the eyes of even the most receptive of c-suites, not that helpful to win your case for budget and dev time to improve the actual experience the site users are getting.
Web Perf: Rise of the Web Vitals
That 800-pound Gorilla? It's dropped a new initiative called Web Vitals, it's a focus on 3 main metrics to focus on whilst measuring the performance of a site full details on web.dev/vitals.
Along with this focus on fewer, clearer metrics, they've backed this up by announcing that these will be ranking factors. A pretty compelling argument to take to that reluctant c-suite that this is something worth caring about, and committing dev time and resources too.
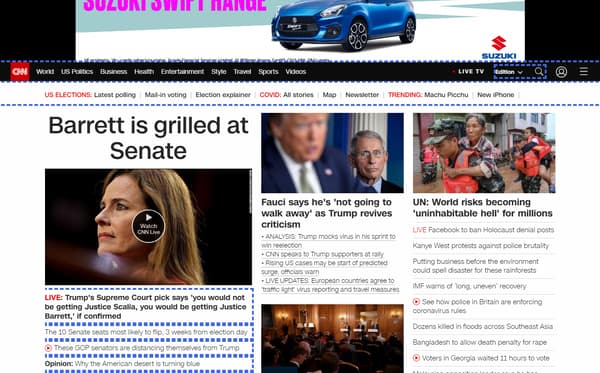
To sweeten the deal further, they also announced that they will breaking the hegemony AMP has until now held over the top stories block shown on mobile search results. This hits right at the heart of some of the worst historical “offenders”, big news media sites. These have traditionally been quite slow, heavy pages, with a fair amount of ads driven jank.
The AMP framework was designed to address these issues, and AMP pages do tend to score well in the new Web Vitals metrics. To say it's been universally loved, would be an overstatement. It's a great framework, but sites have been reluctant to be forced to use a something they see as Google owned. Now the opportunity to “Build it Our Way” is here. Just don't build rubbish.
So what are these metrics?
Cumulative Layout Shift (CLS):
Cumulative Layout Shift is a measure of the percentage of the visible screen affected by movement. We've all been there on a site, gone to click something and the layout has shifted, so we click on nothing, or even worse, the wrong thing. It's not just clickable targets that are an issue, reading an article and the layout suddenly shifts can be hugely off-putting, a reader loses their place, you might very likely have lost that reader.
As a metric, it's perhaps the one furthest removed from the old speed is all way of thinking, and really is more about user experience.
It can also be a little tricky to understand at first, it's not really about how much one element has moved in the screen, it's about how much of the visible area (the viewport) of the site is affected. A small element moving a longer distance may lead to a lower CLS score than a big element moving a shorter distance.
I have put together a quick demo to show this, it will only work in chromium based browsers, as the measurement relies on the Layout Stability API, not yet supported by all browsers.
If you narrow the width of your browser (if you are on mobile, try in landscape and portrait), the CLS score with count up much faster, That's because more of the screen area is affected by the moving block.
The metric is also designed not to be punitive to user interaction, so when you interact with the screen, like clicking on a dropdown, measurement is paused for ½ a second.
The metric is expressed as a fraction of the screen affected, which means if you times it by 100, you get the percentage of the screen affected.
A new element loading in or appearing won't add to the layout shift calculations on its own either, but if it's pushing other content out of the way when it does, that does count.
Scores:
Scores for CLS have been set as:
- Good: Under 0.1
- Needs Improvement: 0.1 to 0.25
- Poor: Over 0.25
More Resources:
- About CLS: web.dev/cls/
- Improving CLS: web.dev/optimize-cls/
- Understanding Cumulative Layout Shift: youtu.be/zIJuY-JCjqw
Largest Contentful Paint (LCP)
This is a measure of how long it takes for the largest bit of content shown in the viewport to get rendered and shown to the user. This can be a block of text, an image, a video, or if you are doing it wrong, an ad.
In the past, metrics like First Contentful Paint (FCP) and First Meaningful Paint (FMP) were leaned on, but there's issues with both these metrics. FCP could be any content, most users aren't eagerly waiting the breadcrumbs to load in.
FMP is a tricky to calculate, because it's hard to determine what's meaningful and what's not in a simple test, and small changes in the page load could lead to very different elements being picked as the meaningful ones, and the test was therefore inconsistent.
Enter LCP, it's a much simpler solution, the largest bit of content is, well the largest bit of content. That in 99% of cases is going to be the thing that catches the users eye, it's what they are going to consider important to the page, and there experience of it.
Scores:
Scores for LCP have been set as:
- Good: Under 2½ seconds
- Needs Improvement: 2½ to 4 seconds
- Poor: Over 4 seconds
More Resources:
- About LCP: web.dev/lcp/
- Improving LCP: web.dev/optimize-lcp/
First Input Delay (FID)
First input delay is a measure of how responsive a site is to user interaction, it's the time it takes between a user doing something like clicking a link or using a button, and the site in the browser being able to react to that.
It's annoying as a user to click on something like a dropdown and the browser pauses, and freezes up for a period until the thing you wanted to happen happens.
Poor performance here is often a good indication that the main thread of the browser is otherwise occupied trying to parse and execute costly JavaScript.
This can also be like a slow death from a 1000 papercuts, each individual delay might be short, but as they add up as the user clicks, scrolls and interacts with your site, each little delay adding to the perception of a slow and unsatisfying experience
Scores:
Scores for FID have been set as:
- Good: Under 100 microseconds
- Needs Improvement: 100 to 300 microseconds
- Poor: Over 300 microseconds
More Resources:
- About FID: web.dev/fid/
- Improving FID: web.dev/optimize-fid/
Measuring Web Vitals
One of the focuses in the Web Vitals initiative is a unifying of metrics across a lot of different surfaces, so there's a good number of places to get and gather these metrics from. You can group them into 2 distinct groups, Lab tests, performed by tools designed to simulate the user experience, and real user measurements (RUM), which gather data from actual users of a site. Both are handy, both are useful and you should probably look at both to get a full understanding of where you lie.
Lab Tests
Lighthouse Powered:
- PageSpeed Insights: Open PageSpeed Insights
- web.dev Measure: web.dev/measure/
- Lighthouse (from V.6):, powers the above tests, and is available as a command line tool, and in the chrome browser devTools. at the time of this article version 6 has yet to be added to stable chrome, and is avaialble in Chrome Canary only, but it will be coming to the normal, stable chrome browser soon. Read more here More about Lighthouse 6
- My Fetch & Render Tool: You can run a Lighthouse 7 test on a URL in my Fetch & Render Tool
- My mass Web Vitals CLI tool: a node CLI script that lets to test a list of URLs from a csv and captures a screencast video and the CWV metrics Get massWebVitals from Github
All the Lighthouse tools lack the FID measurement, as these tests don't interact with the page. A good metric to look at in place is Total Blocking Time, and improvements in this usually are good for FID too.
Non-Lighthouse Powered:
These following to methods kind of stride Lab based testing and real user monitoring. They are collecting real user metrics, BUT… that user is always you. That can be problematic as it's not a distributed cross section of users, and it's a snapshot. These methods don't offer collection of data over time, that's why I chose to classify them as Lab tests.
Web Vitals Chrome Extension: View in Chrome Store. A handy Chrome extension that lets you see the metrics for any page you are browsing.
This bookmarklet I've created:
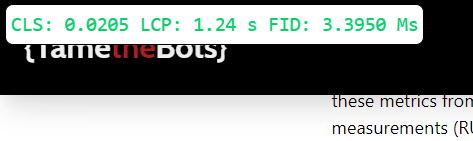
You can drag & drop the button below onto your bookmarks bar, then when looking at a site, choose the bookmark and it will overlay the figures for you. It accesses the same APIs as the Web Vitals extension.
Update: April 15th, 2021 - The bookmarklet now outputs the 'old' style CLS, and the new maximum session window with 1 second gap, capped at 5 seconds one
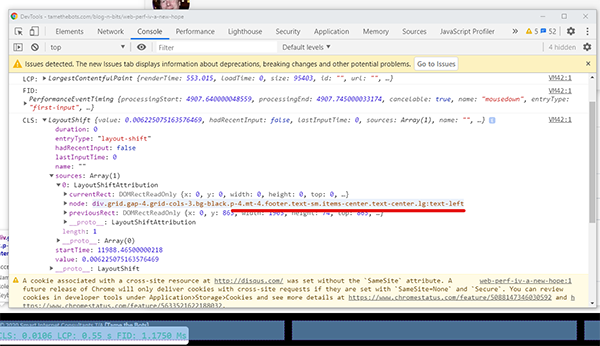
Update: July 25th, 2020 - This updated version also outputs the entries to the devTools console, that means that if you are using Chrome 84+, you can now get the actual elements that caused shifts.
Update: October 13th, 2020 - Now adds blue dotted outlines to items that shifted, and a gold dotted border to the LCP
If you can't drag and drop for some reason, here's the code, and you can follow the guidance in my Simple SEO Related Chrome Bookmarklets post to install it.
        javascript: (function () {
            const myStringOfstyles= `
                .ttb-lcp-candidate {
                    outline: 4px dashed goldenrod !important;
                    outline-offset: -4px;
                }
                `;
                var style = document.createElement('style');
                style.innerText = myStringOfstyles;
                document.head.appendChild(style);
            function sendToHolder({
                name,
                delta,
                verdict
            }) {
                var holder = document.getElementById('webVitalsHolder');
                if (typeof (holder) === 'undefined' || holder === null) {
                    var holder = document.createElement('div');
                    holder.id = 'webVitalsHolder';
                    holder.style.position = 'fixed';
                    holder.style.bottom = 0;
                    holder.style.left = 0;
                    holder.style.margin = '5px';
                    holder.style.padding = '5px';
                    holder.style.fontFamily = 'monospace';
                    holder.style.fontSize = '1.5rem';
                    holder.style.backgroundColor = '#fff';
                    holder.style.color = '#000';
                    holder.style.border = '1px solid #000';
                    holder.style.borderRadius = '0.5rem';
                    holder.style.boxShadow = '0 25px 50px -12px rgba(0,0,0,.25)';
                    holder.style.zIndex = '999999';
                    document.body.appendChild(holder);
                }
                var element = document.getElementById('webVital-' + name);
                if (typeof (element) !== 'undefined' && element !== null) {
                    if (verdict === 0) {
                        element.style.color = '#0cce6b';
                    } else if (verdict === 1) {
                        element.style.color = '#ffa400';
                    } else if (verdict === 2) {
                        element.style.color = '#ff4e42';
                    }
                    element.innerText = ` ${name}: ${delta}`;
                } else {
                    var extractionSpan = document.createElement('span');
                    extractionSpan.id = 'webVital-' + name;
                    if (verdict === 0) {
                        extractionSpan.style.color = '#0cce6b';
                    } else if (verdict === 1) {
                        extractionSpan.style.color = '#ffa400';
                    } else if (verdict === 2) {
                        extractionSpan.style.color = '#ff4e42';
                    }
                    extractionSpan.innerText = ` ${name}: ${delta}`;
                    holder.appendChild(extractionSpan);
                }
            }
            let CLS = 0,
            LCP = 0,
            FID = 0,
            CLSmax = 0,
            CLSCurr = 0;
            sendToHolder({
                name: 'old CLS',
                delta: CLS.toFixed(4),
                verdict: 0
            });
            sendToHolder({
                name: 'new CLS',
                delta: CLSmax.toFixed(4),
                verdict: 0
            });
            var firstHiddenTime = document.visibilityState === 'hidden' ? 0 : Infinity;
            document.addEventListener('visibilitychange', (event) => {
                firstHiddenTime = Math.min(firstHiddenTime, event.timeStamp);
            }, {
                once: true
            });
            new PerformanceObserver(list => {
                list.getEntries().forEach(entry => {
                    if (entry.hadRecentInput) return;
                        const elist = entry.sources;
                        console.log(`CLS:`, entry);
                        console.log(`Shifted:`);
                        elist.forEach((e) => {
                            if(e.node && e.node.nodeType !== 3) {
                            let exStyle = e.node.style.cssText;

                             e.node.style.cssText = `${exStyle} outline: 4px dashed royalblue; outline-offset: -4px;`;
                            }
                        });
                    CLS += parseFloat(entry.value);
                    var ver = 0;
                    if (CLS > 0.1 && CLS <= 0.25) {
                        ver = 1;
                    }
                    if (CLS > 0.25) {
                        ver = 2;
                    }
                    sendToHolder({
                        name: 'old CLS',
                        delta: CLS.toFixed(4),
                        verdict: ver
                    });
                });
            }).observe({
                type: 'layout-shift',
                buffered: true
            });
            let firstTs = Number.NEGATIVE_INFINITY,
            prevTs = Number.NEGATIVE_INFINITY;
        new PerformanceObserver((entryList) => {
            for (const entry of entryList.getEntries()) {
                if (entry.hadRecentInput) continue;
                if (entry.startTime - firstTs > 5000 || entry.startTime - prevTs > 1000) {
                    firstTs = entry.startTime;
                    CLSCurr = 0;
                }
                prevTs = entry.startTime;
                CLSCurr += entry.value;
                CLSmax = Math.max(CLSmax, CLSCurr);
                let ver = 0;
                if (CLSmax > 0.1 && CLSmax <= 0.25) {
                    ver = 1;
                }
                if (CLSmax > 0.25) {
                    ver = 2;
                }
                sendToHolder({
                    name: 'new CLS',
                    delta: CLSmax.toFixed(4),
                    verdict: ver
                });
            }
        }).observe({ type: 'layout-shift', buffered: true });
            new PerformanceObserver(list => {
                list.getEntries().forEach(entry => {
                    LCP = parseFloat(entry.renderTime);
                    if (LCP === 0) {
                        LCP = parseFloat(entry.loadTime);
                    }
                    [].forEach.call(document.querySelectorAll('.ttb-lcp-candidate'), function (el) {
                        el.classList.remove('ttb-lcp-candidate');
                    });
                    console.log(`LCP:`, entry);
                    if(entry.element) {
                        entry.element.classList.add('ttb-lcp-candidate');
                    }
                    var ver = 0;
                    if (LCP > 2500 && LCP <= 4000) {
                        ver = 1;
                    }
                    if (LCP > 4000) {
                        ver = 2;
                    }
                    sendToHolder({
                        name: 'LCP',
                        delta: `${(LCP / 1000).toFixed(2)} s`,
                        verdict: ver
                    });
                });
            }).observe({
                type: 'largest-contentful-paint',
                buffered: true
            });
            new PerformanceObserver(list => {
                list.getEntries().forEach(entry => {
                    FID = parseFloat(entry.processingStart - entry.startTime);
                    console.log(`FID:`, entry);
                    var ver = 0;
                    if (FID > 100 && FID <= 300) {
                        ver = 1;
                    }
                    if (FID > 300) {
                        ver = 2;
                    }
                    sendToHolder({
                        name: 'FID',
                        delta: `${FID.toFixed(4)} Ms`,
                        verdict: ver
                    });
                });
            }).observe({
                type: 'first-input',
                buffered: true
            });
        })();
You might need to click or tap on the screen once to see the FID, and if no CLS is measured (i.e. the CLS score is zero), the metric will not be shown. The Web Vitals extension is great, and comes with the huge benefit of getting auto updates, the bookmarklet doesn't, so if the metrics change a little down the road, you'll need to manually update this.
Despite that, there's a good reason I created it. I wanted a way to take a look at these figures whilst I was on my mobile, and you can't install the extension on mobile Chrome. However, if you are logged in on your Chrome on both your desktop and mobile, and you sync your bookmarks, this will become available to use.
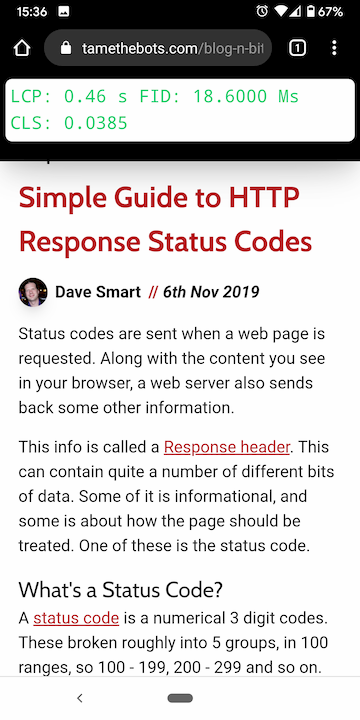
If you have synced your bookmarks, when you are looking at a page in chrome on your mobile, open the address bar and start typing Show Web Vitals, and the Bookmark should show:
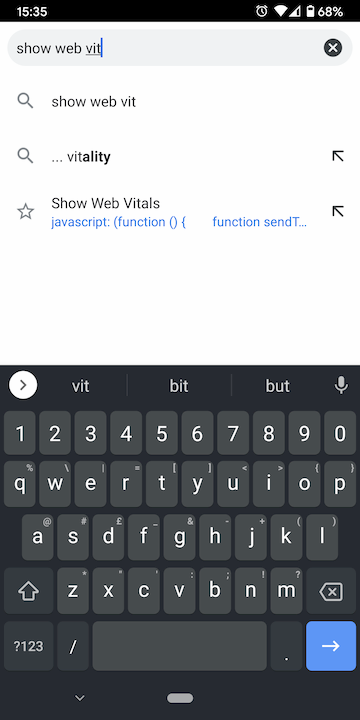
Click on it, and you will see the same metrics as you would on your desktop:
A Warning About Single Page Applications (SPAs)
A single page application works on, as the name suggests, a single web page, when you move to the next page, it's built in the browser, so whilst you see a new page, what you are actually seeing is the same page with the content changed.
Both the Web Vitals Extension, and my bookmarklet start an observer for the page and collect those metrics, so seeing at it's the same page, these aren't restarted across page views if you are clicking around. That means that you are seeing the FID & LCP from the first page you visited, and the CLS score is the sum of all the pages you have viewed.
If you want to see this in action, this site is an SPA, if you use the extension, take a look at the figures as you click around the site. Or you can see without installing anything by clicking the green Show Web Vitals button above and clicking around (I recommend the blog pages for seeing this).
Naturally, that could give hugely misleading figures for a page, so if you are on an SPA site, reload the page before looking at the figures!
Real User Monitoring
There's a number of places you can see these figures too, and some tools to help you collect your own.
Collected For You:
These all rely on the CrUX data being available for the site, not all sites have enough traffic for this to be collected.
- Search Console: If you have access to the site's Search Console, there is a handy report Core Web Vitals Report Help Doc
- PageSpeed Insights: If there's enough data, PageSpeed Insights will show this: Open PageSpeed Insights
- The CrUX data: You can access the data in a number of ways find out how
Collect for Yourself:
If you want to collect data for yourself
- web-vitals JavaScript Library A great wrapper for the APIs, with code examples: github.com/GoogleChrome/web-vitals/
- WordPress Plugin: the wonderful folks at SALT.agency have released this WordPress plugin and Google Analytics dashboard: See the Plugin
The advice above about SPA's may be valid here too, if you are gathering your own metrics, you might need to make sure you are taking account of this.
Putting it in Context
Speed & performance is really, desperately important, but it will never take the place of something being genuinely good and useful. Fast trash is still trash.
Being super speedy is good, but it's relative. You don't repeatedly order pizza from the same place, even though it usually comes undercooked, doughy and regularly has hair in it, over the place who's pizza is delicious, because it's 5 mins quicker. There is a reward for the extra 5 mins wait.
The same is true for web sites to some extent. Being speedy alone isn't going to delight your users or save your rankings in the search engines.
Likewise, culling useful features on your site that users like, just for speeds sake is not the way forward. What these metrics do give you is a baseline to look at to make an informed decision if the feature you are shipping is worth the overhead. That's something between the site and it's users to decide in many ways, but Web Vitals gives some the tools to help quantify that.
I did a (halloween themed!) talk around core web vitals, you and see the video and slide deck here: Chilled to the Core Web Vitals
Updates in 2021
Quite a lot of time has passed since I wrote this article, and a few things have changed over time!
- On the 15th June 2021, the page experience ranking factor rolled out for mobile search, and a 2022 timeline announced for a desktop rollout..
- The way CLS is measured evolved in June too.
- New potential metrics were announced, watch the Chrome Dev Summit announcement: